Potential Income

Successful AAMCO franchisees earn far more revenue than the average mechanic shop owner

Your potential income and individual earnings will, of course, vary depending on your market, the mix of services you offer, and other factors. However, AAMCO franchise owners have been known to take in $838,792* annualized average gross sales per center.

AAMCO: A Proven, Top-Rated Brand.

Partnering with a nationally known brand with 60+ years of expertise and customer trust means that the groundwork already is laid. Our franchisees benefit from the AAMCO legacy the day they open their doors. AAMCO enjoys overwhelming brand recognition in the lucrative transmission repair sector. We’ve won the nation’s trust to fix the most complicated part of the car. This ability is a huge boon to our franchisees, as transmission repair is one of the most expensive parts to fix. AAMCO franchise owners enjoy much higher margins than traditional auto repair shops that specialize in oil changes. AAMCO, as the industry specialist in transmission repair, requires a lower volume of customers to drive significant revenue.

The cost of repairing hybrid and electric vehicles is one of the most promising revenue streams for AAMCO franchise owners. AAMCO invested in hybrid and electric vehicles for technicians to receive hands-on training at our state-of-the-art training facility, AAMCO University. Since launching the program, we already have trained hundreds of technicians and are introducing marketing campaigns to get the word out that AAMCO is positioning itself to be ready, qualified, and competent in hybrid and electric vehicle repair.

Beyond the profit margins of complex car repair and the extensive training at AAMCO University, the investments AAMCO made in new technologies extend directly to our franchisees, who now have industry-leading tools to help manage their businesses and increase profitability. Our point-of-sale system provides AAMCO franchisees with executive-class analytics that are updated to the minute and are accessible from anywhere in the world. AAMCO also launched a consumer financing platform, which allows franchise owners
to make more high-ticket sales without burdening their customers. View the numbers for yourself.

A look at how AAMCO locations are performing, taken from Item 19 of our 2022 FDD*

The below financial performance representations include information on specified subsets of AAMCO Centers operating during recent fiscal years with respect to: (i) average and median gross sales figures; and (ii) franchisee-reported performance results. We provide the information below to help you evaluate the potential performance of an AAMCO Center by showing actual historical data of franchised AAMCO Centers. Please carefully read all information contained in this Item 19, including the notes accompanying and the statements following all tables, which further explain the figures shown below.

Average Gross Sales of AAMCO Centers in Prior Fiscal Year

This financial performance representation is based on actual gross sales figures of AAMCO Centers during our prior fiscal year ended December 31, 2021. Among the 555 total franchised AAMCO Centers in the United States and Canada that were open at the end of our prior fiscal year (see Item 20), this representation includes only those 536 locations that operated continuously under the same owner throughout that fiscal year and reported revenue data for that year (the “Operating Centers”). All the Operating Centers are generally comparable to the franchise opportunity we offer in this FDD, in that the centers used the prototypical business format and operating procedures we prescribe for all AAMCO Center franchises.

Average Gross Sales of Franchised Centers – 2021

REVENUE BY QUARTILE: The average annual gross sales of the Operating Centers were $838,792, and the median annual gross sales of the Operating Centers per year were $782,498. The following table shows average annual and median gross sales of the Operating Centers by quartile, the count of Operating Centers within each quartile that exceeded the quartile’s average gross sales, and the percentage of those Operating Centers within each quartile that exceeded the quartile’s average gross sales during the fiscal year:

Quartile# of Operating Centers% of Operating Centers2021 Average Total Sales2021 Median Total Sales# of Centers that attained or exceeded Average% of Centers that attained or exceeded Average
1st13525%$1,328,954$1,250,3305037%
2nd13425%$903,657$894,3786448%
3rd13425%$685,612$692,7007455%
4th13425%$436,945$459,2927657%
Total536100%$838,792$782,49823644%

INDUSTRY COMPARISON:  AAMCO CENTER GROSS SALES VS. GENERAL REPAIR SHOPS

For comparison purposes, the below representation reflects comparative data showing the average annual gross sales of AAMCO Centers, and selected subsets of AAMCO Centers, against a published industry average of annual gross sales for “general repair automotive shops” (“General Repair Shops”). Based on the AutoCare Fact Book 2022, General Repair Shops averaged $523,334 in annualized revenues during 2020 (and such data is not yet available for 2021 from the same industry source as of this document’s issuance). As referenced above in Table 19.1 of this Item 19, average annual gross sales for AAMCO Center franchisees across the Operating Centers in 2021 were $838,792 (60% higher than General Repair Shops), and median annual gross sales for those Operating Centers in 2021 were $782,498 (50% higher than General Repair Shops).

The following chart shows an annual revenue comparison between General Repair Shops in 2020 and the AAMCO sample set of 536 Operating Centers that were open and operating throughout our prior fiscal year (60% higher than General Repair Shops average, 444 or 83% of which attained or exceeded the industry average), as well as: (i) against 268 AAMCO Centers falling within both quartiles 1 and 2 (113% higher than General Repair Shops average), 268 or 100% of which attained or exceeded the industry average, and (ii) against 134 AAMCO Centers solely within quartile 1 (154% higher than General Repair Shops average), 134 or 100% of which attained or exceeded the industry average:


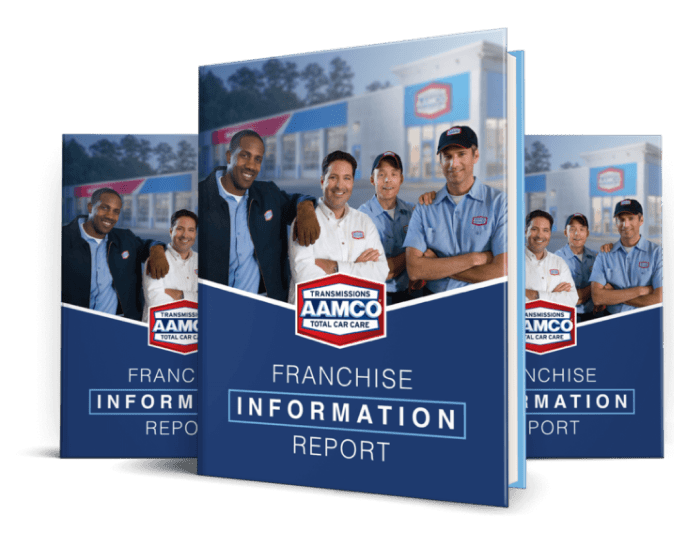
Ready to learn more about the potential income that comes with AAMCO franchise ownership? Fill out the form to download our franchise report and start a conversation with us.

Request Franchise Information

Want to learn more about opening your own AAMCO Franchise? Fill out this form to get started:

  • Hidden
  • Hidden
  • This field is for validation purposes and should be left unchanged.